
Numerically and Experimentally Verified Design of a Small Wind Turbine with Injection Molded Blade
by
 , ,
, ,
Byunghui Kim
1 ,
,
Sang-June Park
2,
Seokyoung Ahn
2,*,
Myung-Gon Kim
3,
Hyung-Gun Yang
3 and
Ho-Seong Ji
4,* 1
Regional Leading Research Center, Changwon National University, Gyeongsangnam-do, Changwon 51140, Korea
2
School of Mechanical Engineering, Pusan National University, 2 Busandaehak-ro 63 beon-gil, Geumjeong-gu, Busan 46241, Korea
3
ESCORTS, Daejeon 34016, Korea
4
MEMS Technology Centre, Pusan National University, 2 Busandaehak-ro 63 beon-gil, Geumjeong-gu, Busan 46241, Korea
*
Authors to whom correspondence should be addressed.
Processes 2021, 9(5), 776; https://doi.org/10.3390/pr9050776
Submission received: 15 December 2020
/
Revised: 13 April 2021
/
Accepted: 24 April 2021
/
Published: 28 April 2021
Abstract
:Although mega-watt class onshore and offshore wind power systems are used to generate power due to their cost-effectiveness, small wind power systems are important for household usages. Researchers have focused on aerodynamic characteristics as a conceptual design from their previous studies on Archimedes spiral wind turbines. Here, we verified the design of a small wind turbine AWM-750D (100 W capacity) via both numerical simulation and experimentation. We used commercial code ANSYS CFX for numerical simulation and compared turbulence models and surface roughness for determining the performance. To obtain reliable and robust blades, we analyzed the effective manufacturing method with Moldflow. Through a test with an open-suction type atmospheric boundary layer wind tunnel, we varied wind speed from 4.0 m/s to the rated value of 12.5 m/s and obtained 106 W, equivalent to a power coefficient of 0.205. In addition, we compared the numerical and experimental power vs. rotational speed and found the former is 6.5% lower than the latter. In this study, we proved that numerical simulations can act as design verification methods to predict wind turbine performances and reliable manufacturing. Through our research, we provided the prototype of a small wind turbine with 100 W to act as an efficient electric power supplier for households and also the stable manufacturing process for complex spiral blades using injection molding.
1. Introduction
Excessive use of fossil fuels resulting from population growth leads to greenhouse gas emissions, especially pollutant emissions [1]. This changes the global climate, which leads to extreme environmental changes. From this sense, the Intergovernmental Panel on Climate Change (IPCC) has discussed how to improve the global environment and reduce the emissions from fossil fuel combustion and is determined to set worldwide regulations [2]. Thus, many countries are encouraged to adopt renewable energy as low-carbon, sustainable, and long-term solutions [3], reducing our dependence on fossil fuels.
Among the renewable energy resources, wind power has been considered as one of the most widely used electrical energy conversion systems. Nowadays, from economic and environmental points of view, the demand for clean and sustainable energy escalates the distribution of onshore/offshore wind turbines. Although mega-watt on and offshore wind power systems are mostly used to generate power due to their cost-effectiveness, small wind power systems are continuously gaining attention for household usage.
The definition of small wind turbines is not apparently easy but generally can be classified by the operational conditions of less than 200 m2 in a rotor swept area and a capacity of 50 kW, as referred by IEC 61400-2 and Wood [4,5]. The world wind energy association (WWEA) suggests that a small wind turbine can be defined as having a capacity of less than 100 kW [6]. In the UK, small wind turbines have capacities of 1.5–50 kW and micro wind turbines less than 1.5 kW [7].
Because small wind turbines produce much less electricity compared with those of mid and large wind turbines, many studies on the former have been conducted to configure hybrid systems [8,9,10]. These studies were aimed to compensate for the restricted operation due to unpredictable natural wind conditions. The wind turbine needs to maintain a secure and continuous power generation in the market. Therefore, it should be essential for them to achieve maximum operability and high efficiency.
Although many studies on small wind turbines were conducted from economic and technical points of view, difficulties in achieving economic benefits from small wind turbines are predicted due to their low power outputs and restricted installation locations in urban environments full of obstacles and buildings. To address these issues, the European Union government has suggested various incentives for small wind turbines installed in the EU by considering geographical conditions, type of turbines, and power output [11]. Other research has been conducted by the economic evaluation of private wind power businesses where on-site seasonal wind conditions might be critical for the benefit [12]. A German researcher claimed that it was profitable to combine different energy storage systems for the economic evaluation of different types of small wind turbines installed at various locations [13]. Notably, both the possible benefits of small wind turbines operating in urban environments and the advantages of economic and environmental aspects were presented [14].
Many studies have been carried out for the aerodynamic design of small wind turbine blades to improve efficiency due to the low wind speed, which is the main disadvantage. Particularly, the design and evaluation of airfoils at a low Reynolds number for the performance estimation, optimization, and noise prediction were studied [15,16,17]. The characteristics and applications of vertical and horizontal axial wind turbines were presented, and the numerical schemes for Darius wind turbines were compared based on various studies [18]. According to Pourrajabian et al. [19], the importance of aerodynamic design and structural robustness was emphasized for further steps. In addition to studies of rotating parts, significant works on the optimization of system control and power conversion have been carried out [20,21]. Previous studies related to this subject presented the aerodynamic characteristics as the preliminary status of the Archimedes spiral wind turbine for its conceptual design only [22].
In this study, we proceeded development and verified the optimal design of a prototype of the Archimedes small wind mill, AWM-750D, via numerical simulations and experiments. Its blade has a unique shape consisting of spirals featuring uneasy manufacturing, and this required stable manufacturing methods as well as performance prediction beforehand. To achieve these goals, we used the two different numerical simulation software of Autodesk Moldflow and ANSYS CFX, and the simulation results were well matched with the experimental results on the prediction of blade manufacturing method and performance.
2. Optimal Design and Manufacturing Principles of Archimedes Wind Turbine
According to the direction of the rotating axis relative to the wind direction, wind turbines are commonly classified as horizontal axis wind turbine (HAWT) and vertical axis wind turbine (VAWT). AWM-750D is a novel wind turbine model based on the Archimedes wind turbine series, a type of HAWT, under development. It contains blades of diameter 0.75 m and rated power of 100 W at 12.5 m/s of wind speed. The turbine blades are spiral-shaped, which is unique compared with those of conventional wind turbines and is registered as a patent, WO 2014/073741 A1 [23].
The power generating part of wind turbines is composed of three blades rotating around a shaft. We manufactured the blade via injection molding instead of rolling and stretching it in an axial direction due to the advantages of structural robustness, quality, and productivity. Figure 1 depicts the development background and major components of the system. We placed a generator upstream of the rotating part and a brake downstream to attain dynamic stability. Moreover, it can direct automatically toward the upcoming wind by drag, which is advantageous for drag-type wind turbines.
The household small wind turbine system is aimed for installation and operation in urban environments, and it is crucial to enhance the operability for competitiveness in the market. The authors [24] analyzed that small wind turbines operating in the city possessed low operability due to uneven and low-speed wind and various buildings and obstacles. Therefore, many studies have stressed the importance of a light-weight and highly efficient blade design.
Plastic injection molding, which is used for manufacturing turbine blades of a unique shape with spirals, is one of the most complex and challenging processes. Here, polymers are formed whilst hot (or plastic) having large and complex molecules. The size variation, entanglement, and orientation affect the material behavior. During the plastic state, polymers act as non-Newtonian viscoelastic fluids. When formed and in use, they are greatly affected by time and temperature. This complex range of attributes signifies that simple classical design theories are ineffective or dangerous. The injection molding process contains many variables such as the polymer type, melt temperature, injection pressure and rate, mold temperature, gate size, gate position, feed geometry, injection profiles, etc. The complex mathematics and physics involved in a full description of the process cannot be simply handled in a regular industrial design context [23]. Therefore, computer-aided polymer flow analysis is necessary to encapsulate the complicated polymer behavior and advanced mathematics in algorithms, which can model the mold filling process.
In this work, a numerical analysis was performed using Autodesk Moldflow advisor for process optimization of the injection of a spiral blade in a mold to obtain a high-quality part. To optimize the produced part, the phenomena occurring during the flow of the melted polymeric material in the mold were analyzed. This led to the optimization of the following variables of the injection process: filling time; pressure during injection, positions of meeting fronts of material, weld lines, air traps, fiber orientation during the flow, volume (shrinkage) contraction and its steadiness, quality during filling, and cooling quality [2,3]. Simulation of the filling process allows for improving the quality of the final part and significant reduction of costs via shortened design and production times.
3. Numerical and Experimental Methods
3.1. Numerical Methods
Numerical simulations are commonly adopted for new product development. Computational fluid dynamics (CFD) was used to study the flow physics of the wind turbine. Its governing equation is composed of the continuity equation and the momentum equation.
Many researchers have investigated the turbulence models of wind turbine blades, such as direct numerical simulation (DNS), large eddy simulation (LES), and Reynolds averaged Navier Stokes (RANS) models. DNS and LES require much more grids than that of RANS, which increases the computation cost. RNG k-epsilon, k-omega shear stress transport could be reliable models of wind turbine blades among two-equation models of RANS [25,26]. RNG k-epsilon model is a modified version of the standard k-epsilon model and is suitable for streamline curvatures, vortices, rotational flows. On the contrary, the SST k-omega model uses k-omega near-wall regions and k-epsilon outer regions. It is believed to yield accurate and reliable solutions for various cases in engineering.
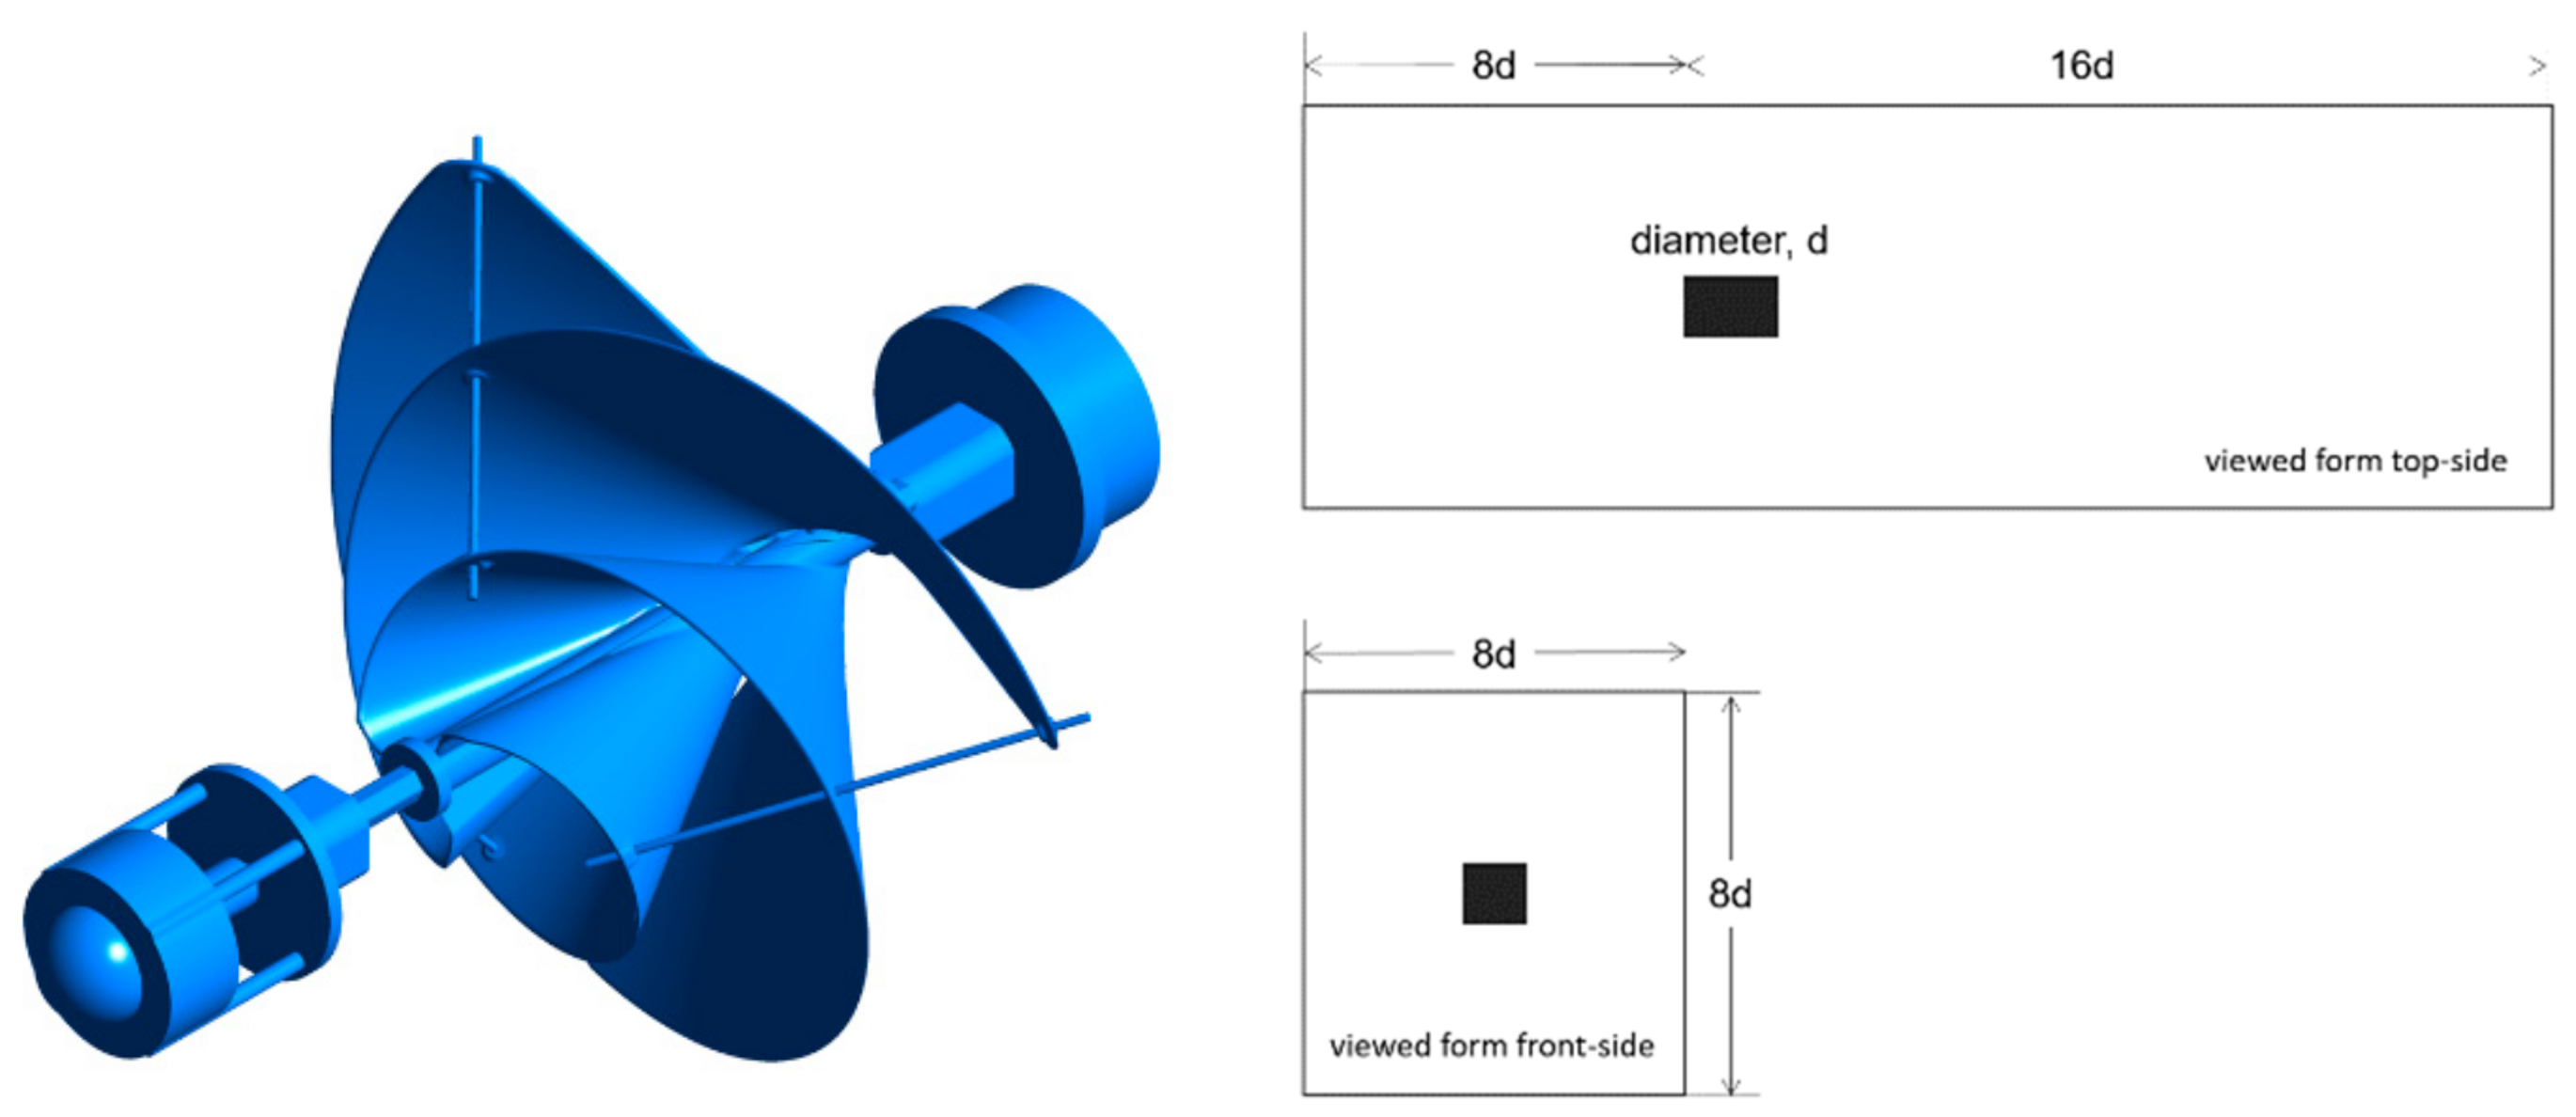
For the CFD done here, we used ANSYS CFX based on the finite volume method (FVM) [26]. Our computational domain was divided into two regions, a rotating and a stationary one, to consider the effect of rotating blades. To exchange calculated variables at its interface of two domains, we treated it with the frozen rotor. For boundary conditions, velocity and opening conditions were imposed at the inlet and other locations. In Figure 2 and Figure 3, the computational domain and fine grids near the surfaces of the rotating and stationary parts are shown. After determining Y+ should be less than 10, a total of 22.4 million elements was obtained.
3.2. Experimental Methods
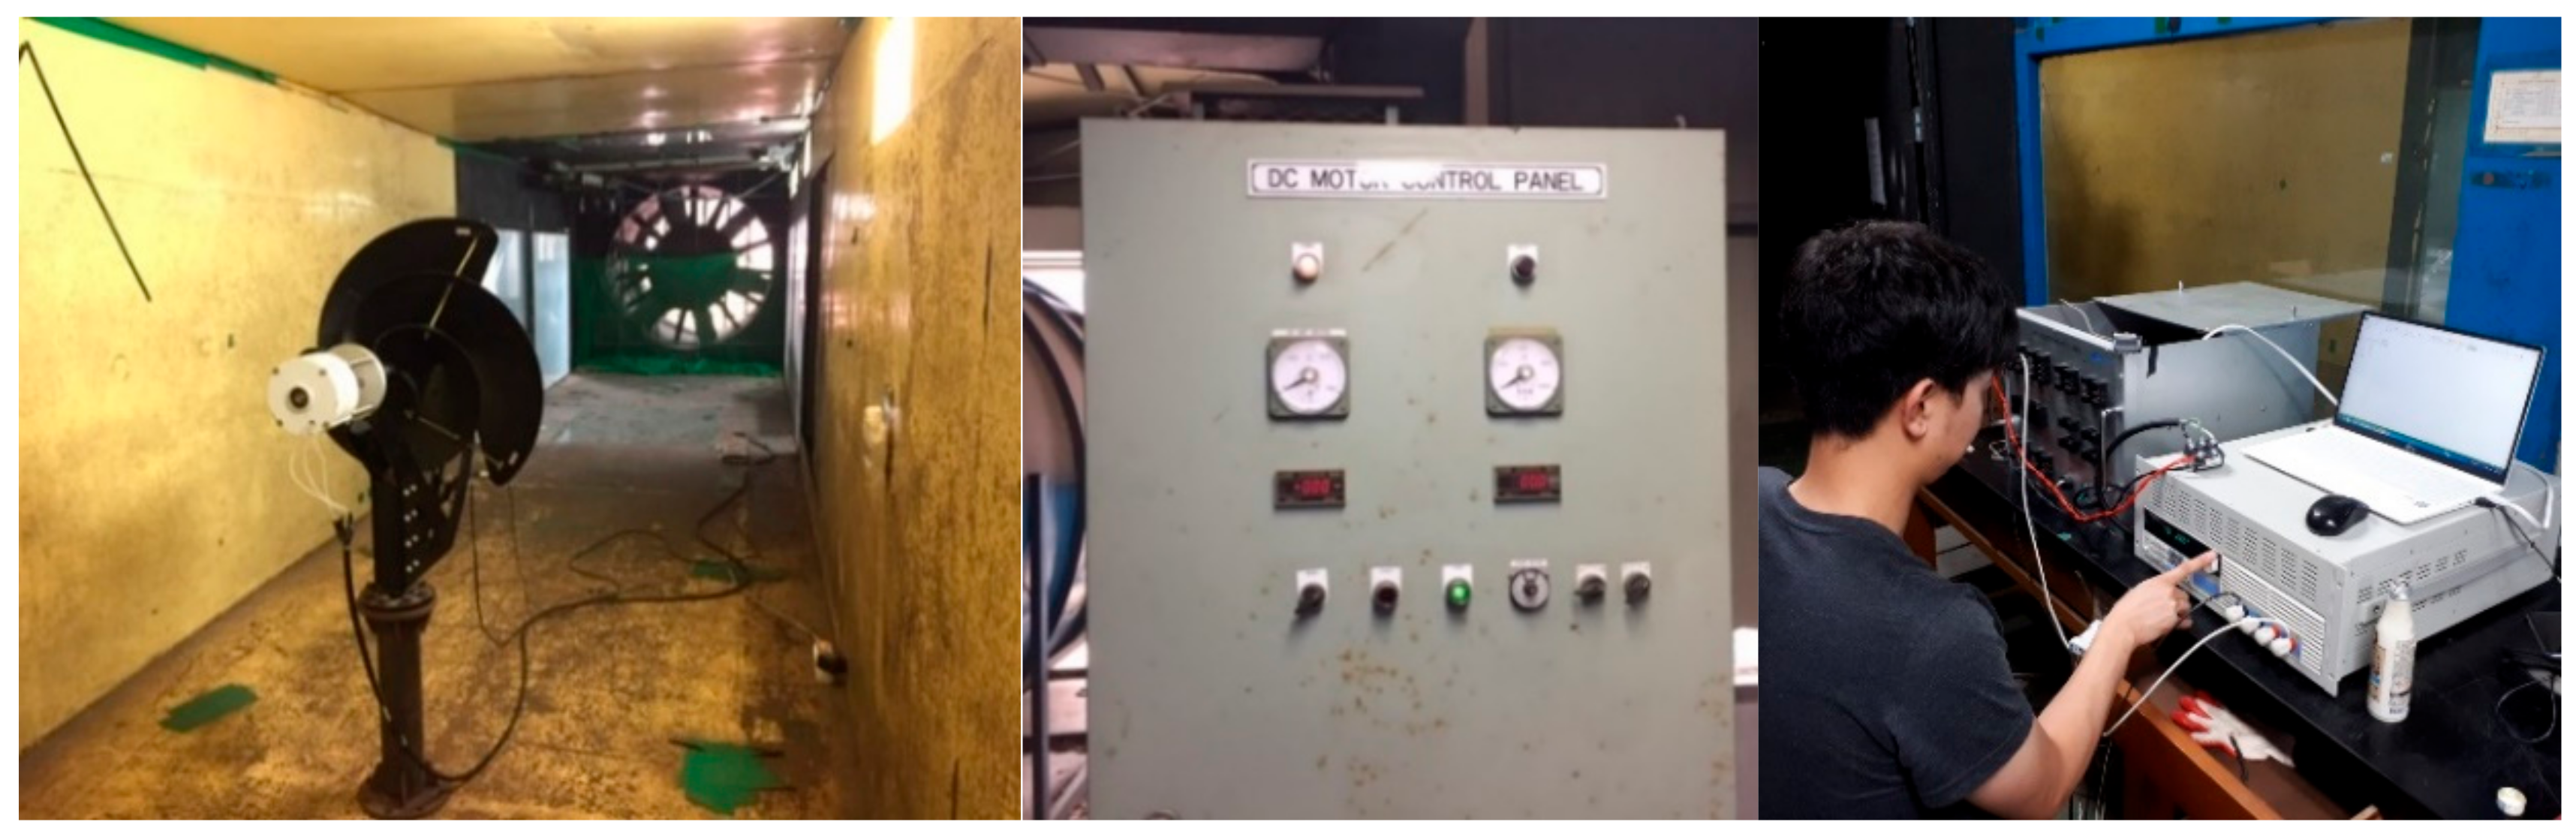
To verify the analytical solution, experiments were performed using an open-suction type atmospheric boundary layer wind tunnel with the test section size as 2.0 m (W) × 2.1 m (H), which can achieve a speed up to 23 m/s with a maximum volume flow rate of 5040 m3/s. This facility has about 5% blockage effects due to boundary layer growth, and we conducted all the procedures and requirements under the guidance of IEC61400.
Figure 4 shows the experimental wind turbine model placed in a wind tunnel. We installed the assembled wind turbine in the facility and proximity sensors (PR08-2DN) to measure the rotational speeds around the rotating shaft. In addition, we connected the DC electronic load measuring device (M9716B) to measure the electricity generated from AWM-750D. The device is used to check signals from sensors and devices according to the wind speed change.
3.3. Boundary Conditions for Injection Molding Analysis
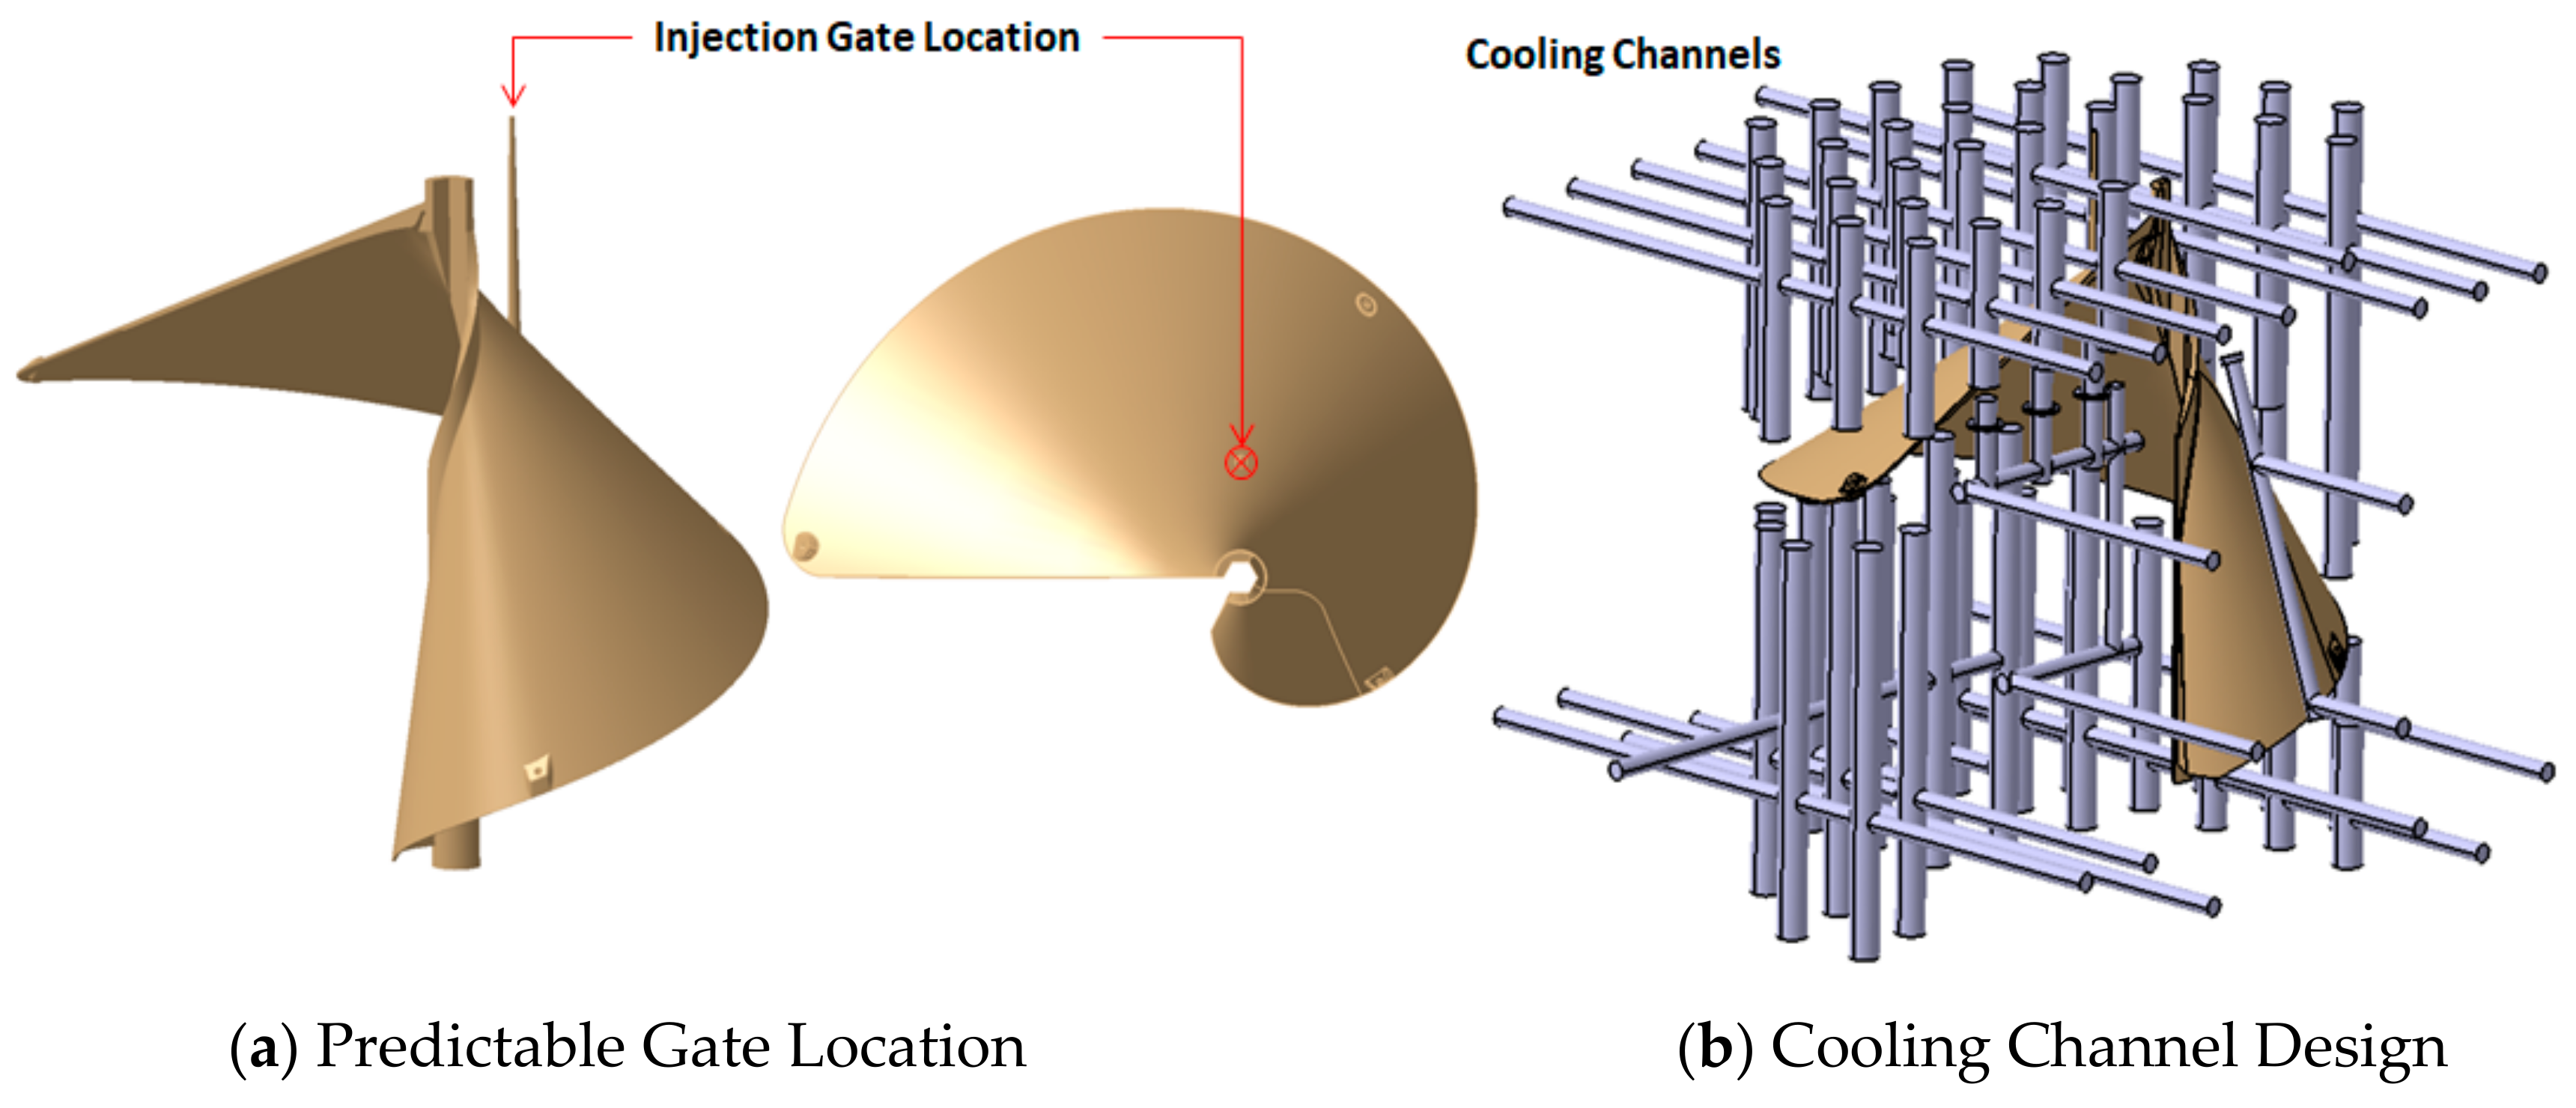
The design of the part used in the molding analysis is given in Figure 5a, while Figure 5b shows the cooling channels used in the simulation. Table 1 shows the dimension of the part along x-, y-, and z-axes.
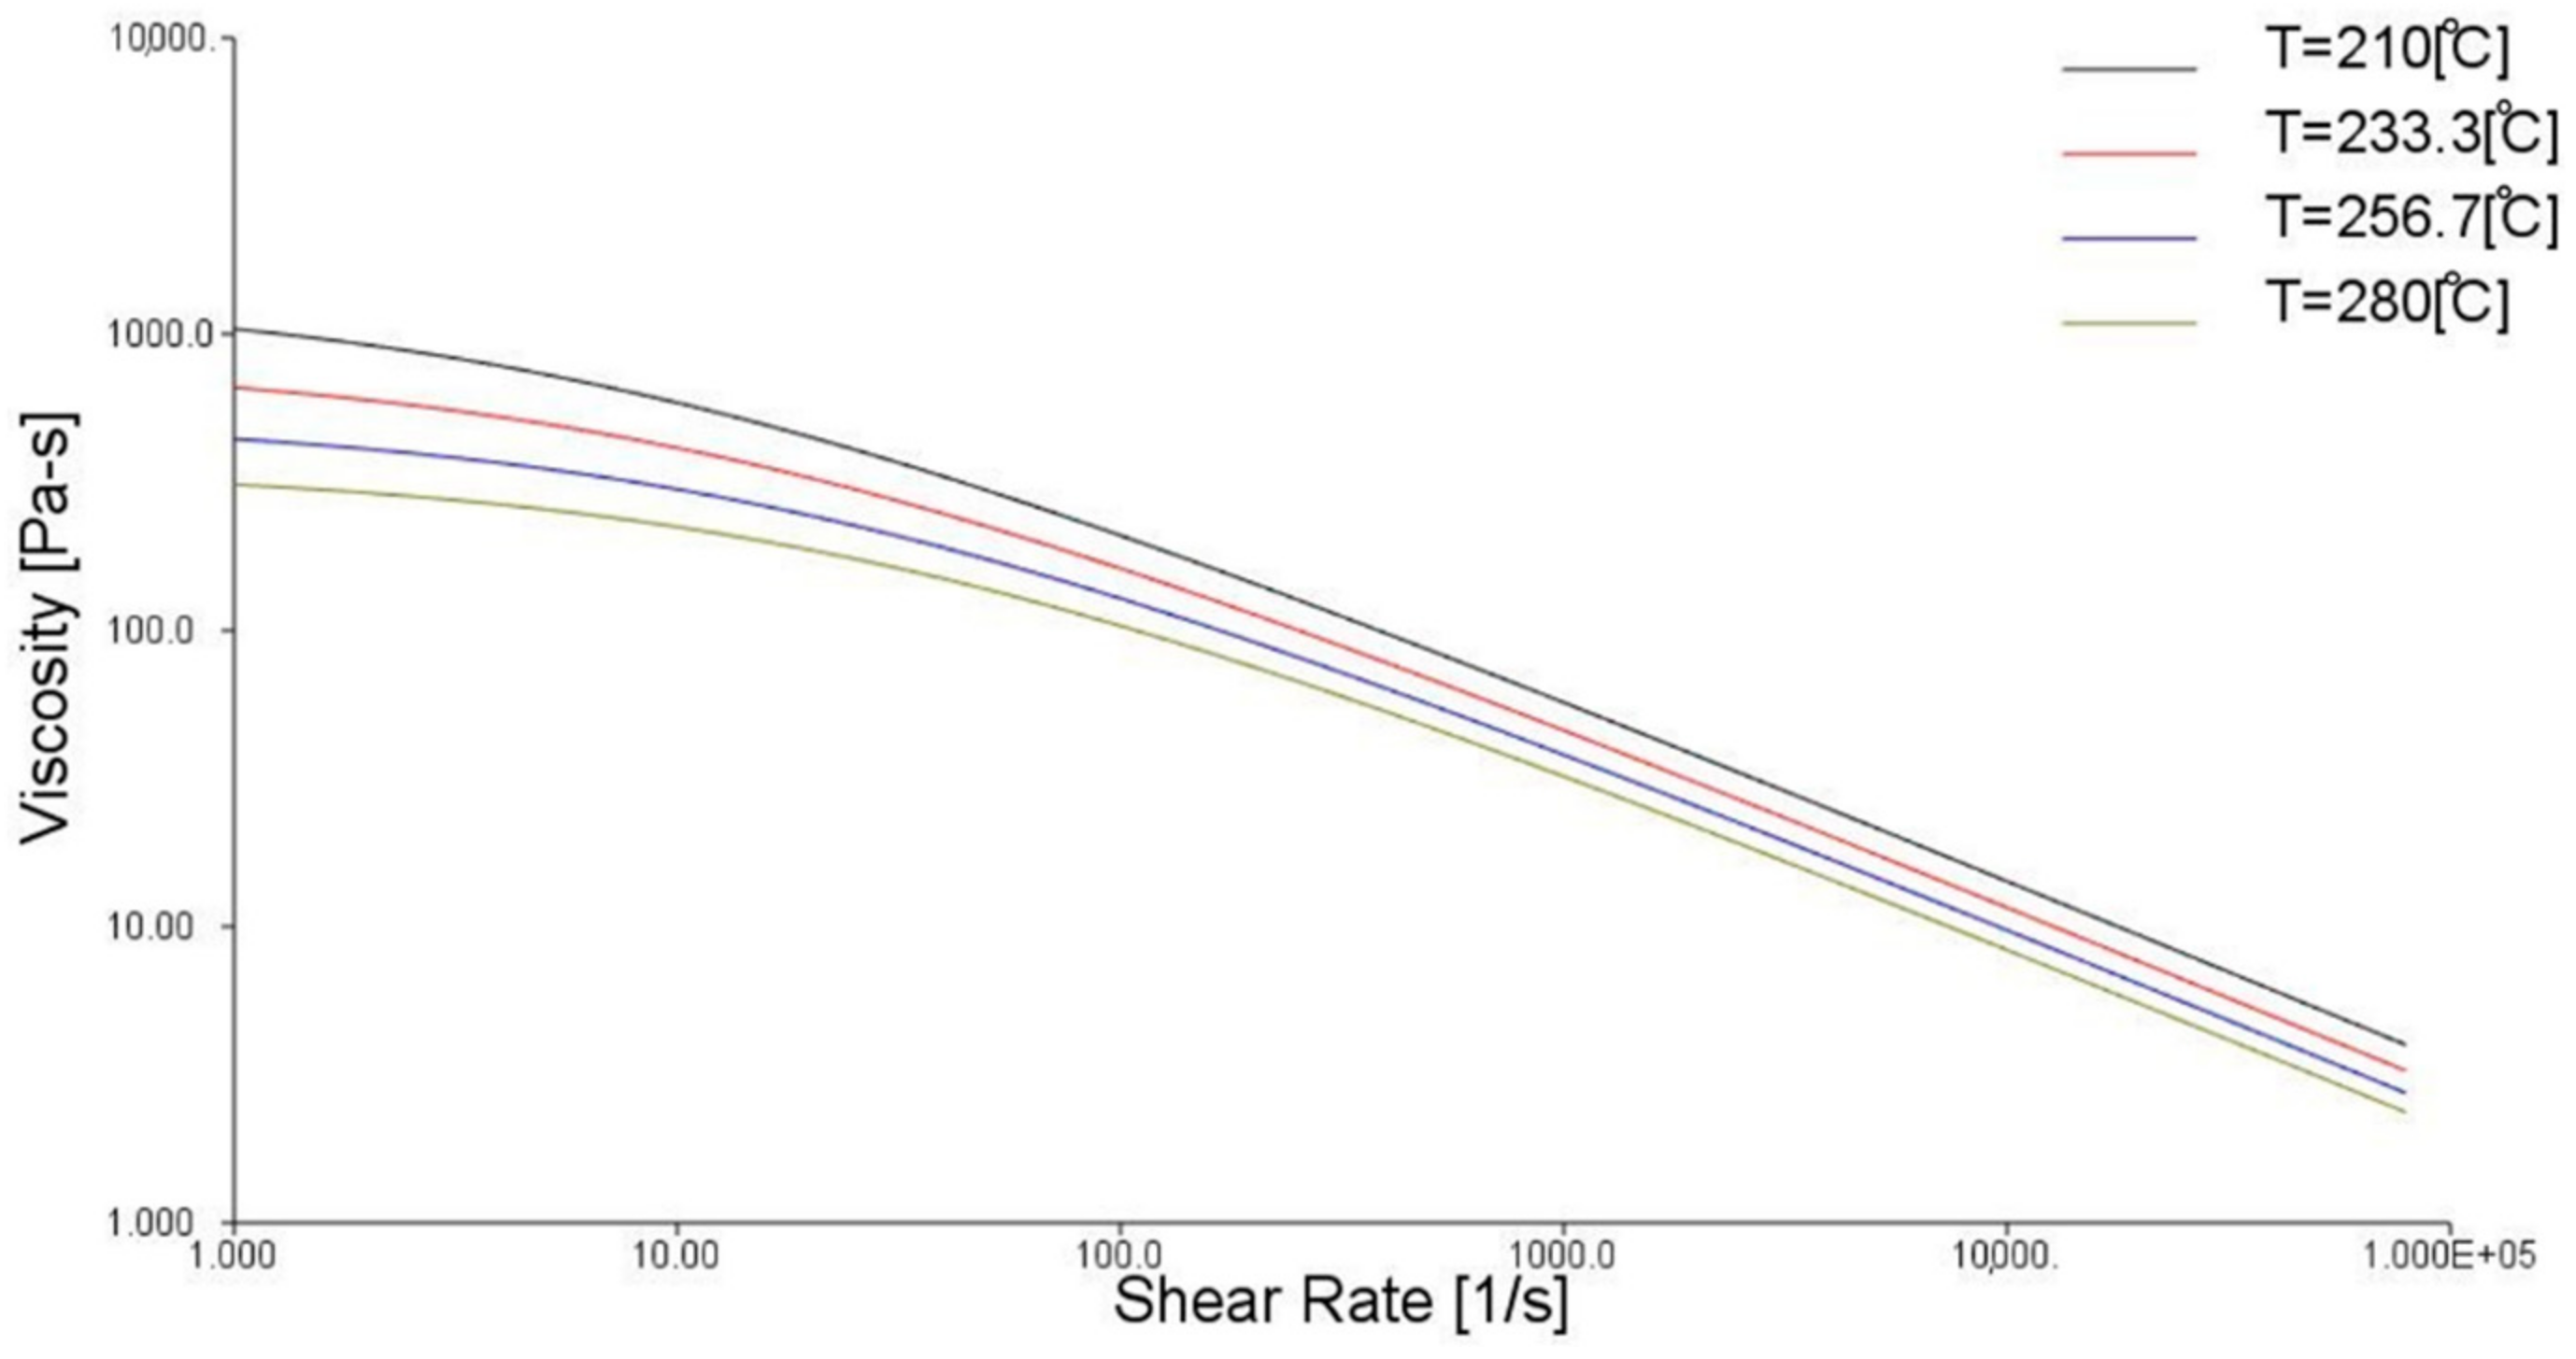
Polypropylene (PP), also known as polypropene, is a thermoplastic polymer used in various applications. It is produced via chain-growth polymerization from the monomer propylene. In this work, Supran PP1340 supplied by SAMBARK LFT Co., Ltd. (Chungcheongnam-do, Yesan-gun, Korea) was used as the polypropylene. Using the Autodesk Moldflow advisor, the rheological behavior data of the feedstock, the other properties of the material, and molding process parameters used in the simulation are organized in Table 2 and Table 3. Figure 6 shows the viscosity plot of the material with respect to the temperature changes.
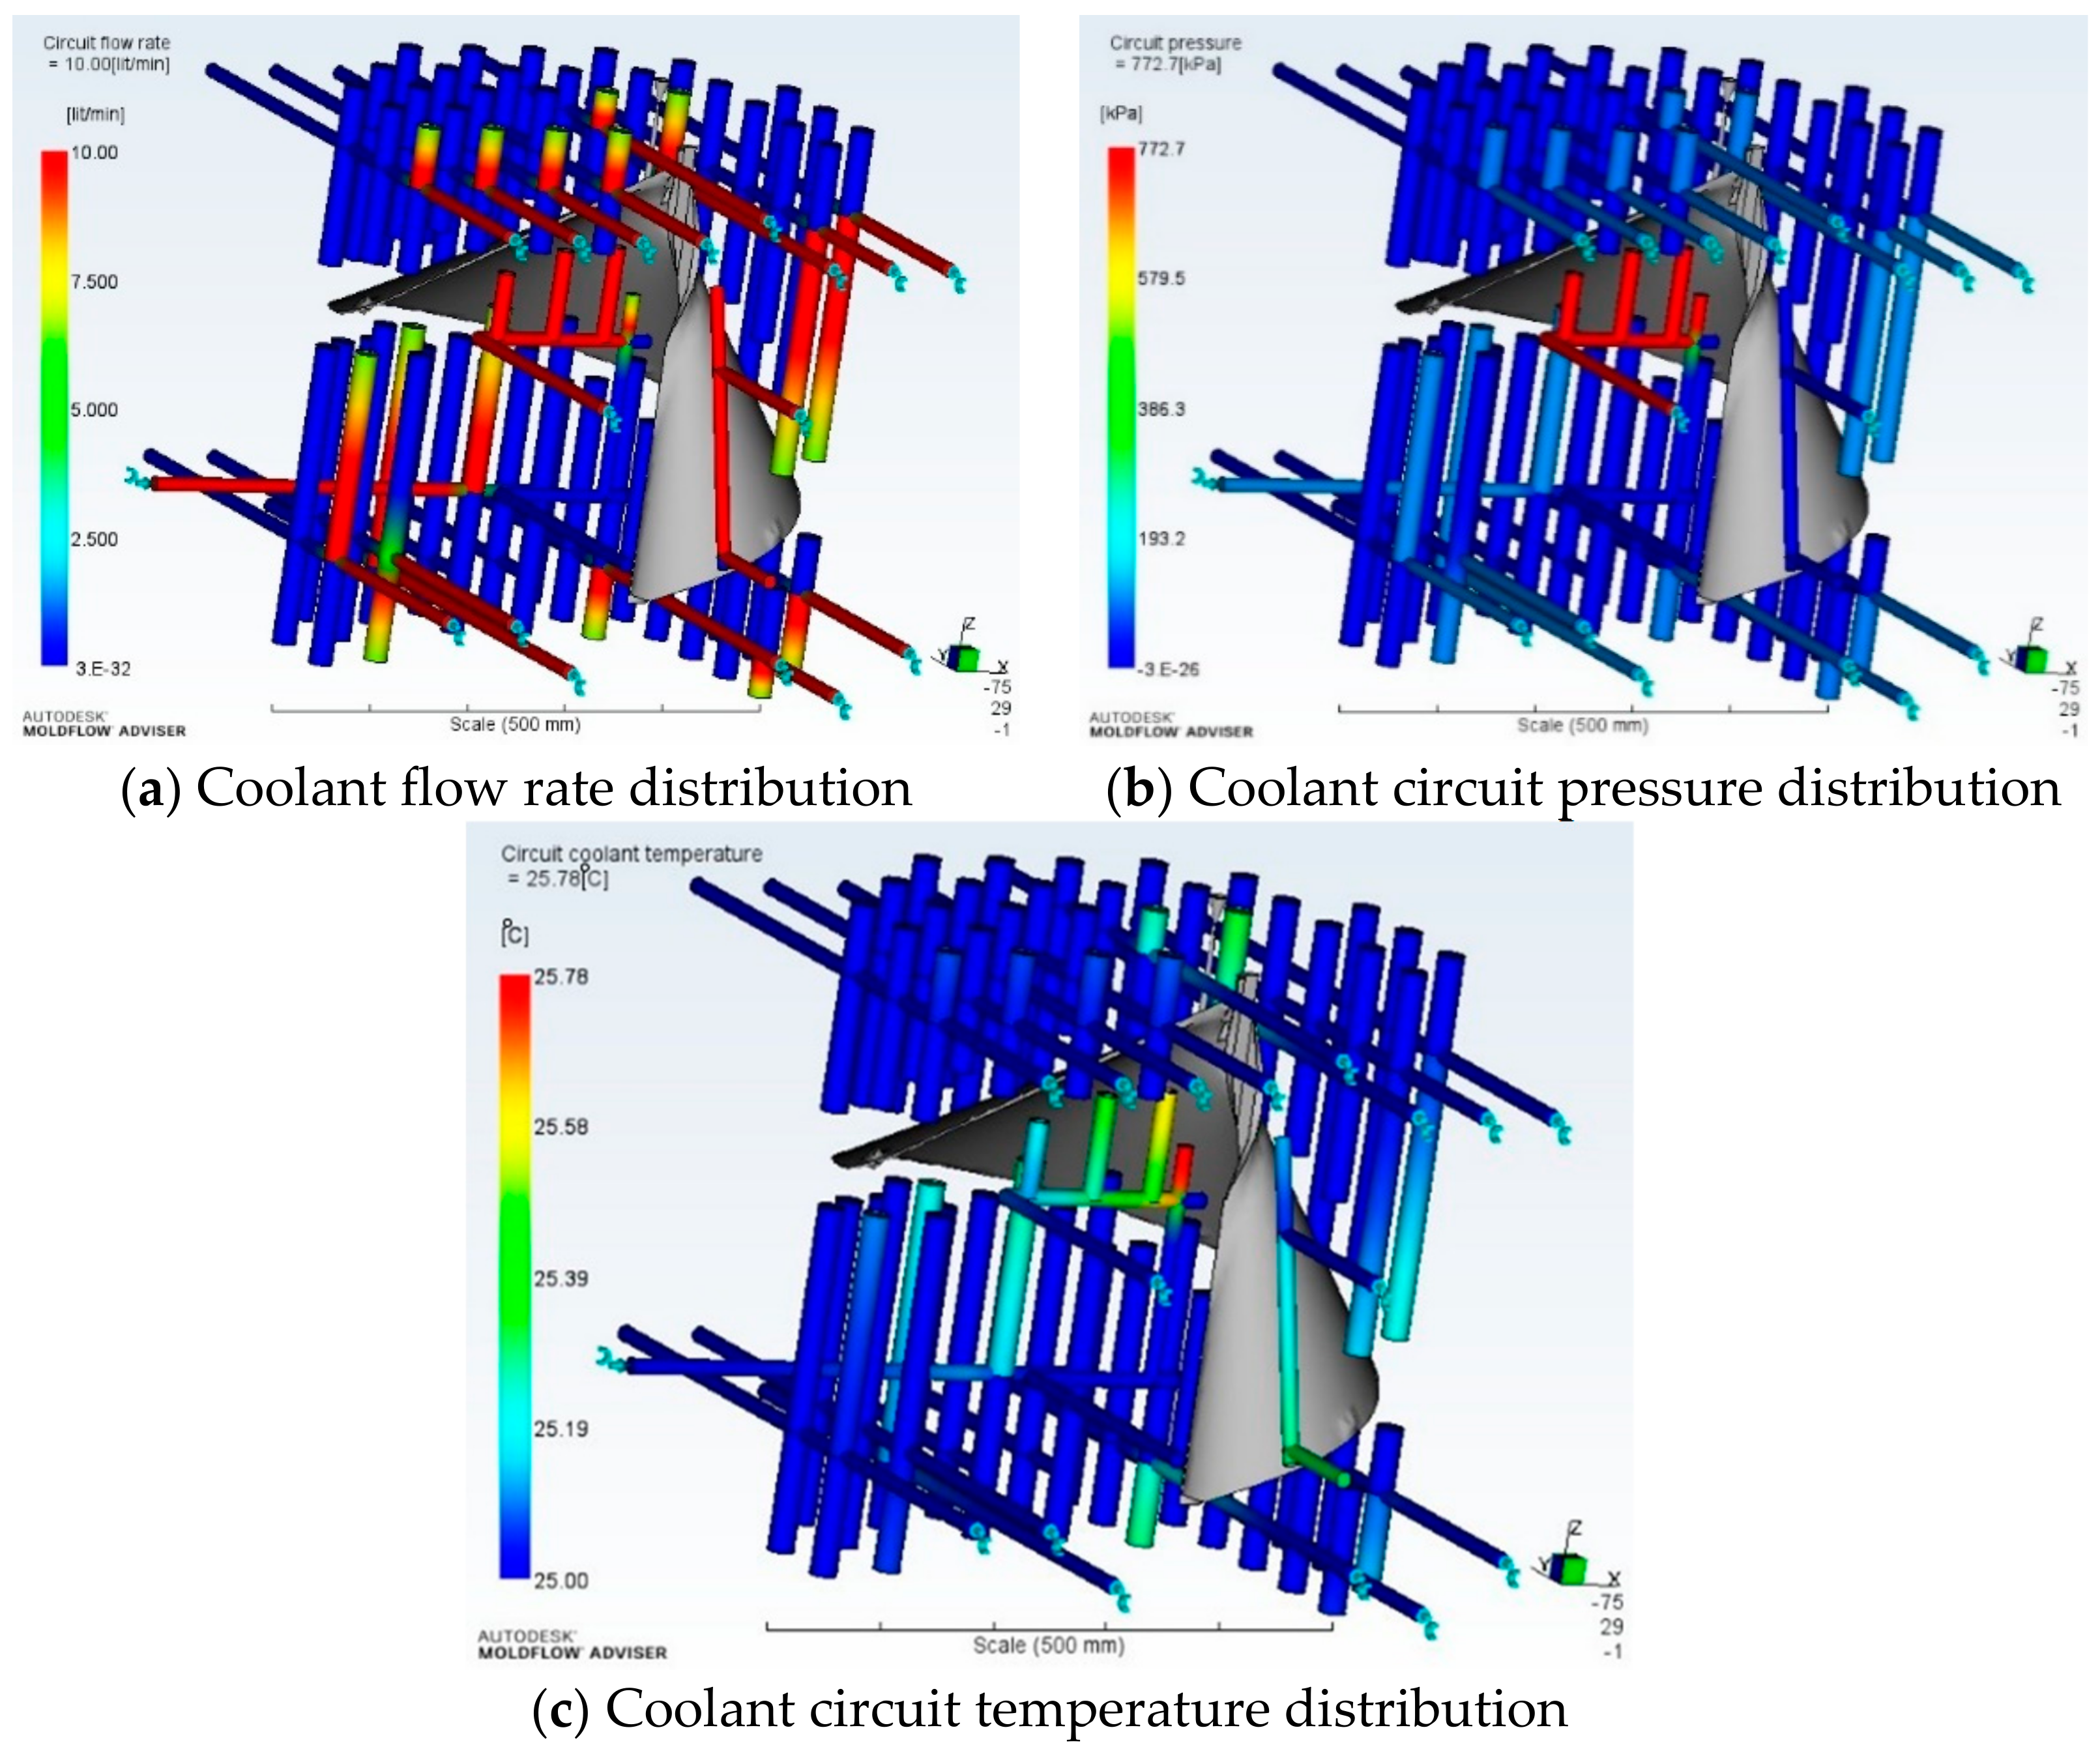
In this simulation, water was used as the coolant. A flow rate of 10 L/min and a temperature of 25 °C were used. The circuit flow rate result shows the flow rate of the coolant inside the cooling circuit in Figure 7. It is seen that the flow rate should be as low as possible to achieve the required circuit Reynolds number. The circuit coolant temperature distribution (Figure 7c) shows the temperature of the coolant inside the cooling circuit. The inlet to outlet temperature rise is no more than 2–3 °C. Higher values indicate a wider mold surface temperature range. In this study, it can be observed that the inlet and outlet temperatures differences are reasonably acceptable for conventional injection molding cooling circuit.
Figure 7b shows the distribution of pressure along the cooling circuit, averaged over the cycle. The pressure inside the cooling circuits should remain evenly distributed from the inlet to the outlet. Large pressure drops in the cooling circuits can result in cooling problems and can be eliminated by altering the dimensions of bubbler and baffles.
4. Results and Discussion
4.1. Numerical Results
In CFD, we aimed to verify the performance of the final prototype, AWM-750D, before market launch. We modified its 3D model to study the blockage and rotational effects of the system.
We analyzed the effects of the number of grids by altering the use of six to twelve boundary layers, which showed a 0.4% increase in the output. For manufacturing, we used injection molding that could lead to a surface roughness issue. The calculation showed 12.16% of torque loss using the roughened surface of 1 mm compared with that of a smooth wall.
Considering turbulence models of RANS widely used in engineering cases, we compared models of torque and power calculation in Table 4. It is evident that SST made the closest prediction to the rated output condition among the RANS models.
In Figure 8, the analysis revealed that the upcoming wind was blocked by a generator and then separated from the surfaces, which increased the inflow blockage. This caused a low velocity and increased pressure in the blade passage. A vortex near the tip edge, which flowed downstream with regular motion, was observed.
From the results of the velocity and pressure contour (Figure 9), it is observed that the surface pressure increased as the blade radius increased except for the backside of the blade tip and swept area due to the supporting rods where the velocity increased.
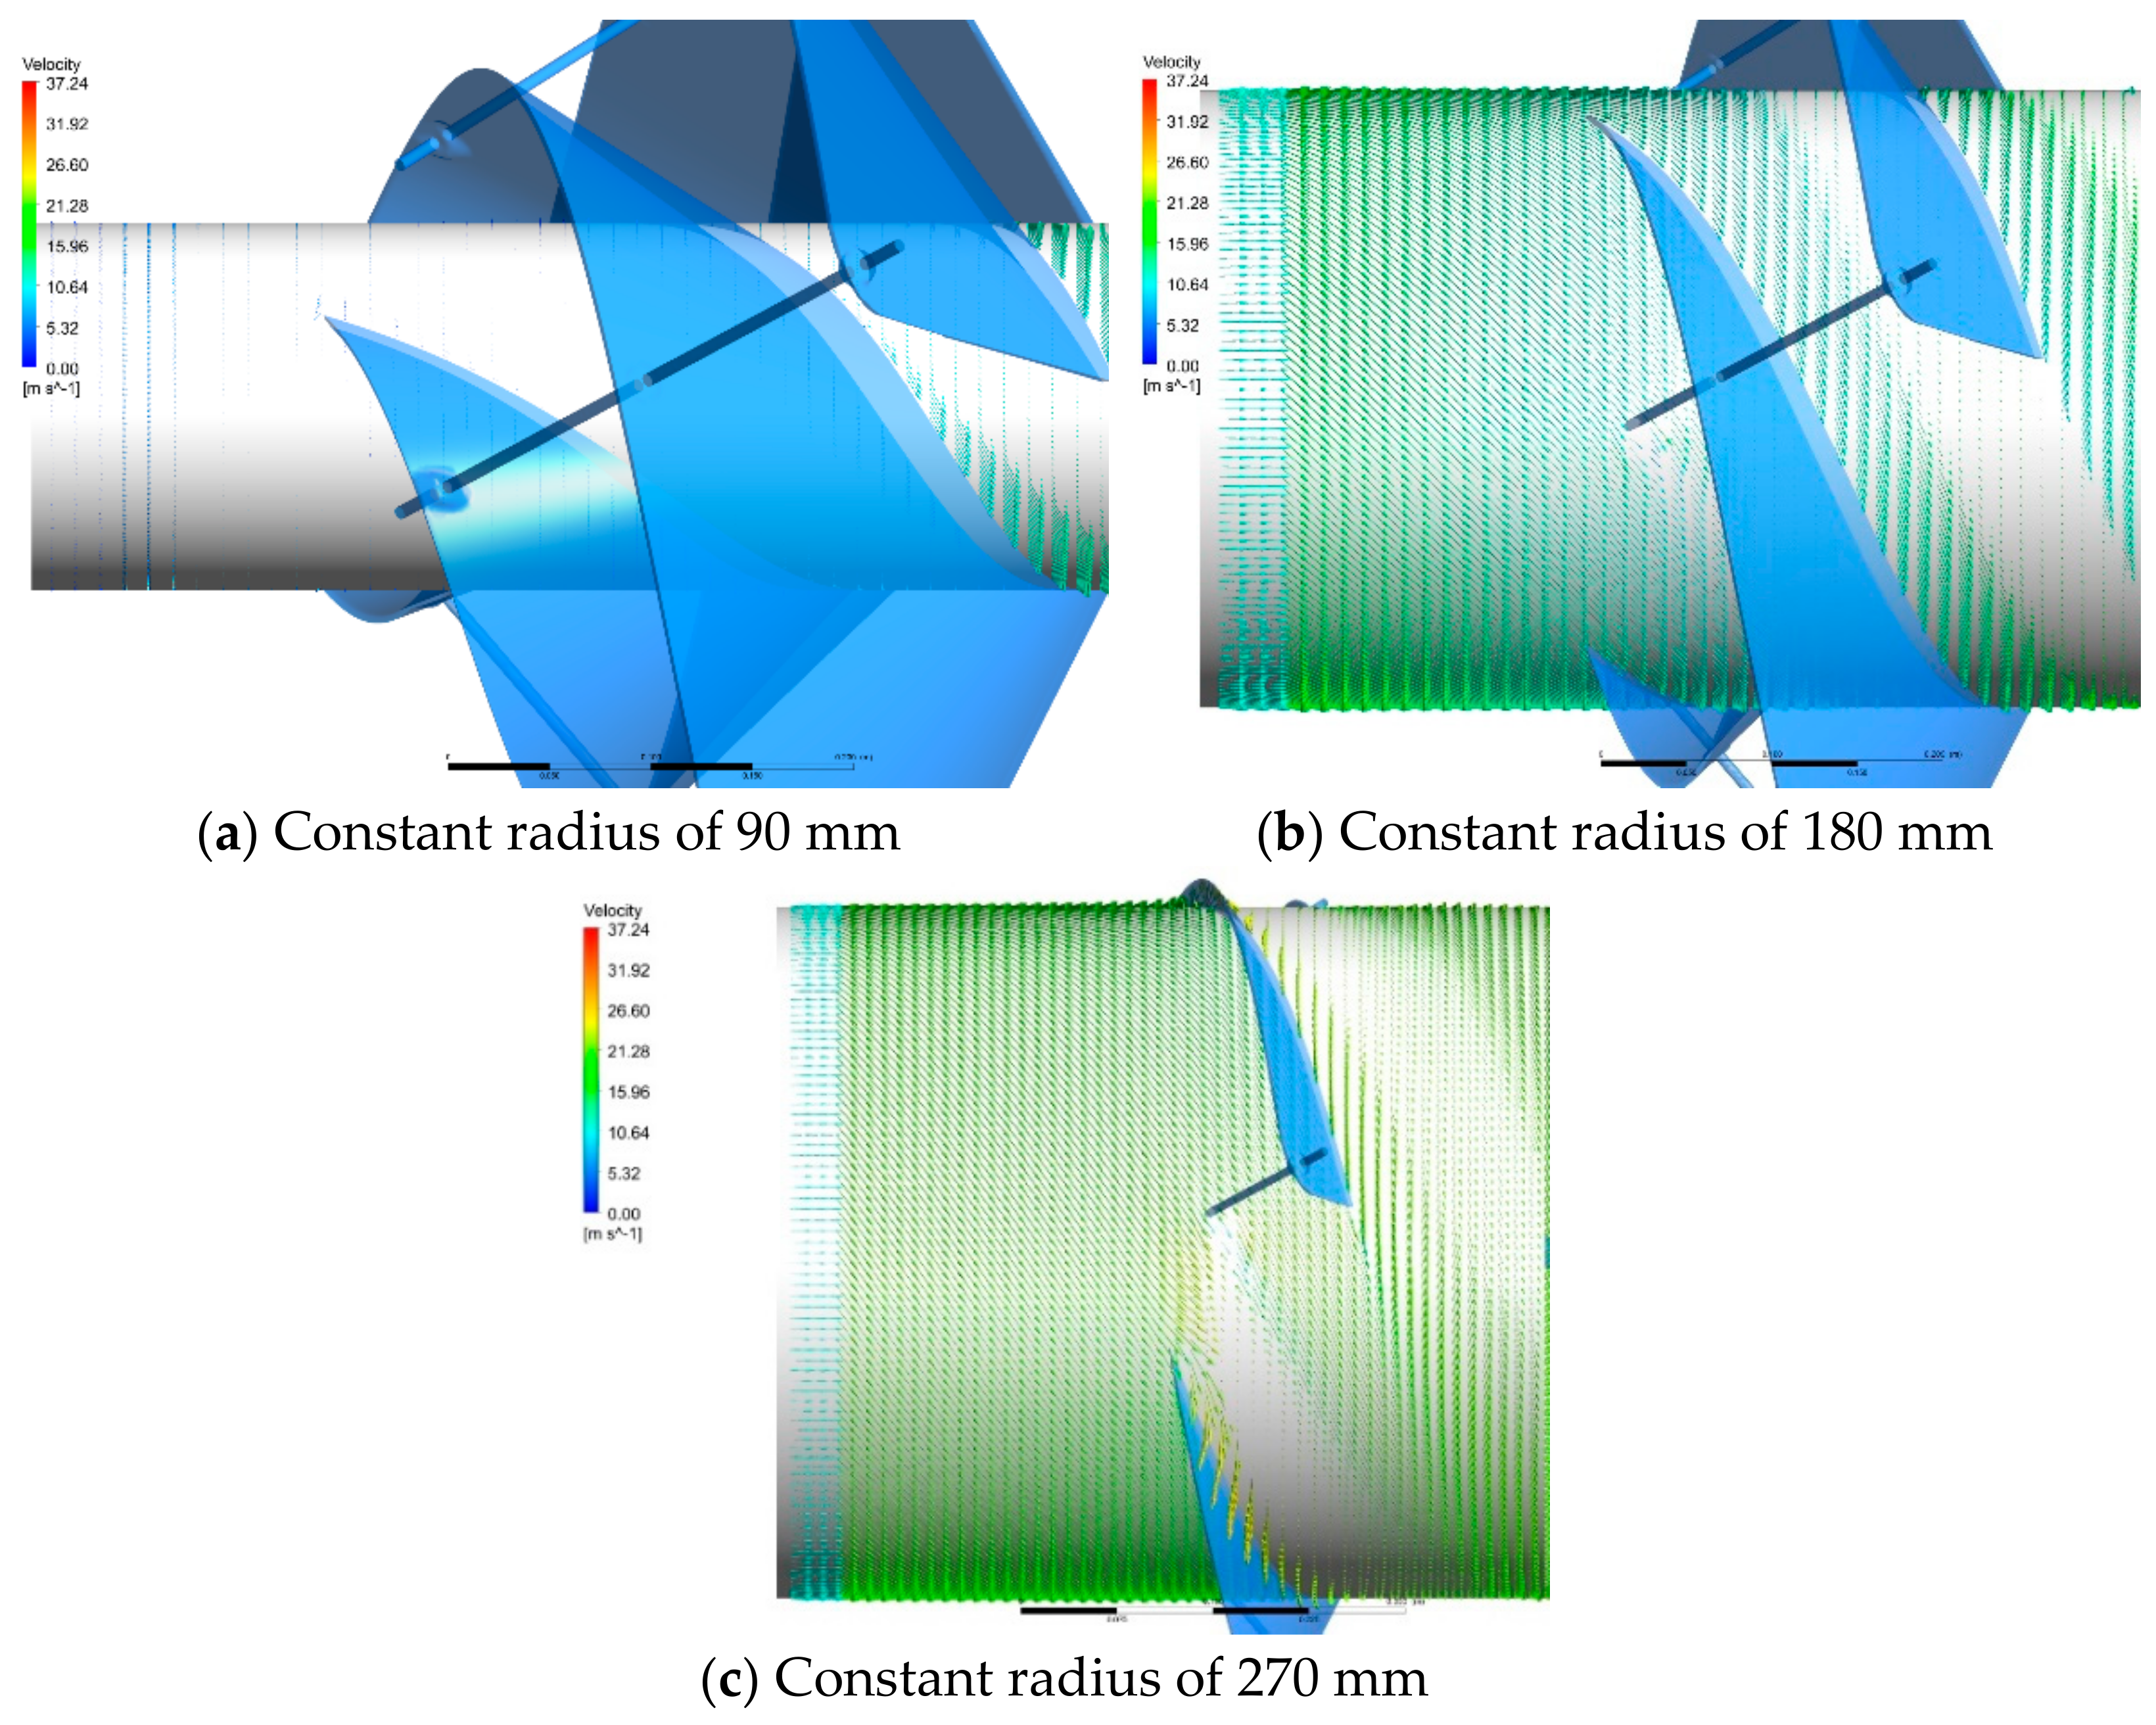
It was critical to understand the motion of flow inside the blade passage. Figure 10 reveals the velocity vector around the cylindrical surfaces at a constant radius. When the radius was smaller than that of the generator, the reverse flow appeared in the blade passage. In addition, the vortex influenced flow directions, which caused low velocities near the pressure side of the blade.
The velocity vector and Q-criterion generally used to indicate vortex were plotted over the rotating blade, as shown in Figure 11. The fluid motion around the blade edge from the high pressure on the pressure side to the low pressure on the suction side results in the generation of vorticity, which stretches due to the continuous interaction with the flow.
Figure 12 shows the model for mass balance analysis of the rotating fluid domain. We observed a mass imbalance in the axial direction because 17.1% of the total mass was left radially in the rotational domain, which led to power reduction.
4.2. Experimental Results
We measured data using various wind speed conditions in the wind tunnel. The lowest speed recorded was 4.0 m/s, which generated about 2 W. As we increased the wind speed by 2.0 m/s sequentially, the power generated became 8–9 W, 21–25 W, and 49–54 W. At its design speed of 12.5 m/s, AWM-750D produced 80–106 W of electricity, as shown in Figure 13. As the wind speed varied, data fluctuations during the measurement process were observed with unresolved causes. This may have influenced test results in a certain way.
Tip speed ratio (TSR) is defined as the ratio of the tip speed to the wind speed (Equation (4)), and the power coefficient expressing the efficiency of wind turbines is calculated as the ratio of the measured power to the available power (Equations (5) and (6)).
Under the Betz limit condition, the relationship between TSR and the power coefficient can determine the ideal value of the latter, and the maximum power coefficient of drag-type wind turbine is 0.16 [27]. Through this test, we surprisingly obtained a higher maximum power coefficient of 0.205 as shown in Figure 14.
In Figure 15, the comparison of the difference between experimental and numerical power vs. rotational speed is shown. The numerically obtained power is seen to be 6.5% lower than the experimental one. We cautiously concluded that the accuracy of measured data led to this difference.
4.3. Injection Molding Analytical Results
We conducted injection molding analysis from a manufacturing perspective separated from performance predictions with Autodesk Moldflow. The results of filling time, confidence, and quality prediction are shown as Figure 16. From them, first of all the position of the melt front at regular interval is seen as the cavity fills in the mold. The contour colors represent the flow of the material into the cavity at different intervals of time. The simulation result shows that the maximum filling time is 4.89 s and the edge of the blade fills at last (left side). The confidence of fill result displays the probability of plastic filling a region within the cavity under conventional injection molding conditions. The quality prediction result is used to estimate the quality of the mechanical properties and appearance of the final part. It is shown that there is possible degradation of the quality nearby gate location.
Figure 17 shows the amount of time required to reach the ejection temperature, which is measured from the start of the cycle, is 259.4 s.
Moreover, the average temperature result (Figure 17) shows the average bulk temperature through the thickness of the part at the end of the fill. The temperature of melted polymer changes not only with time and location but also with thickness during the entire injection molding cycle.
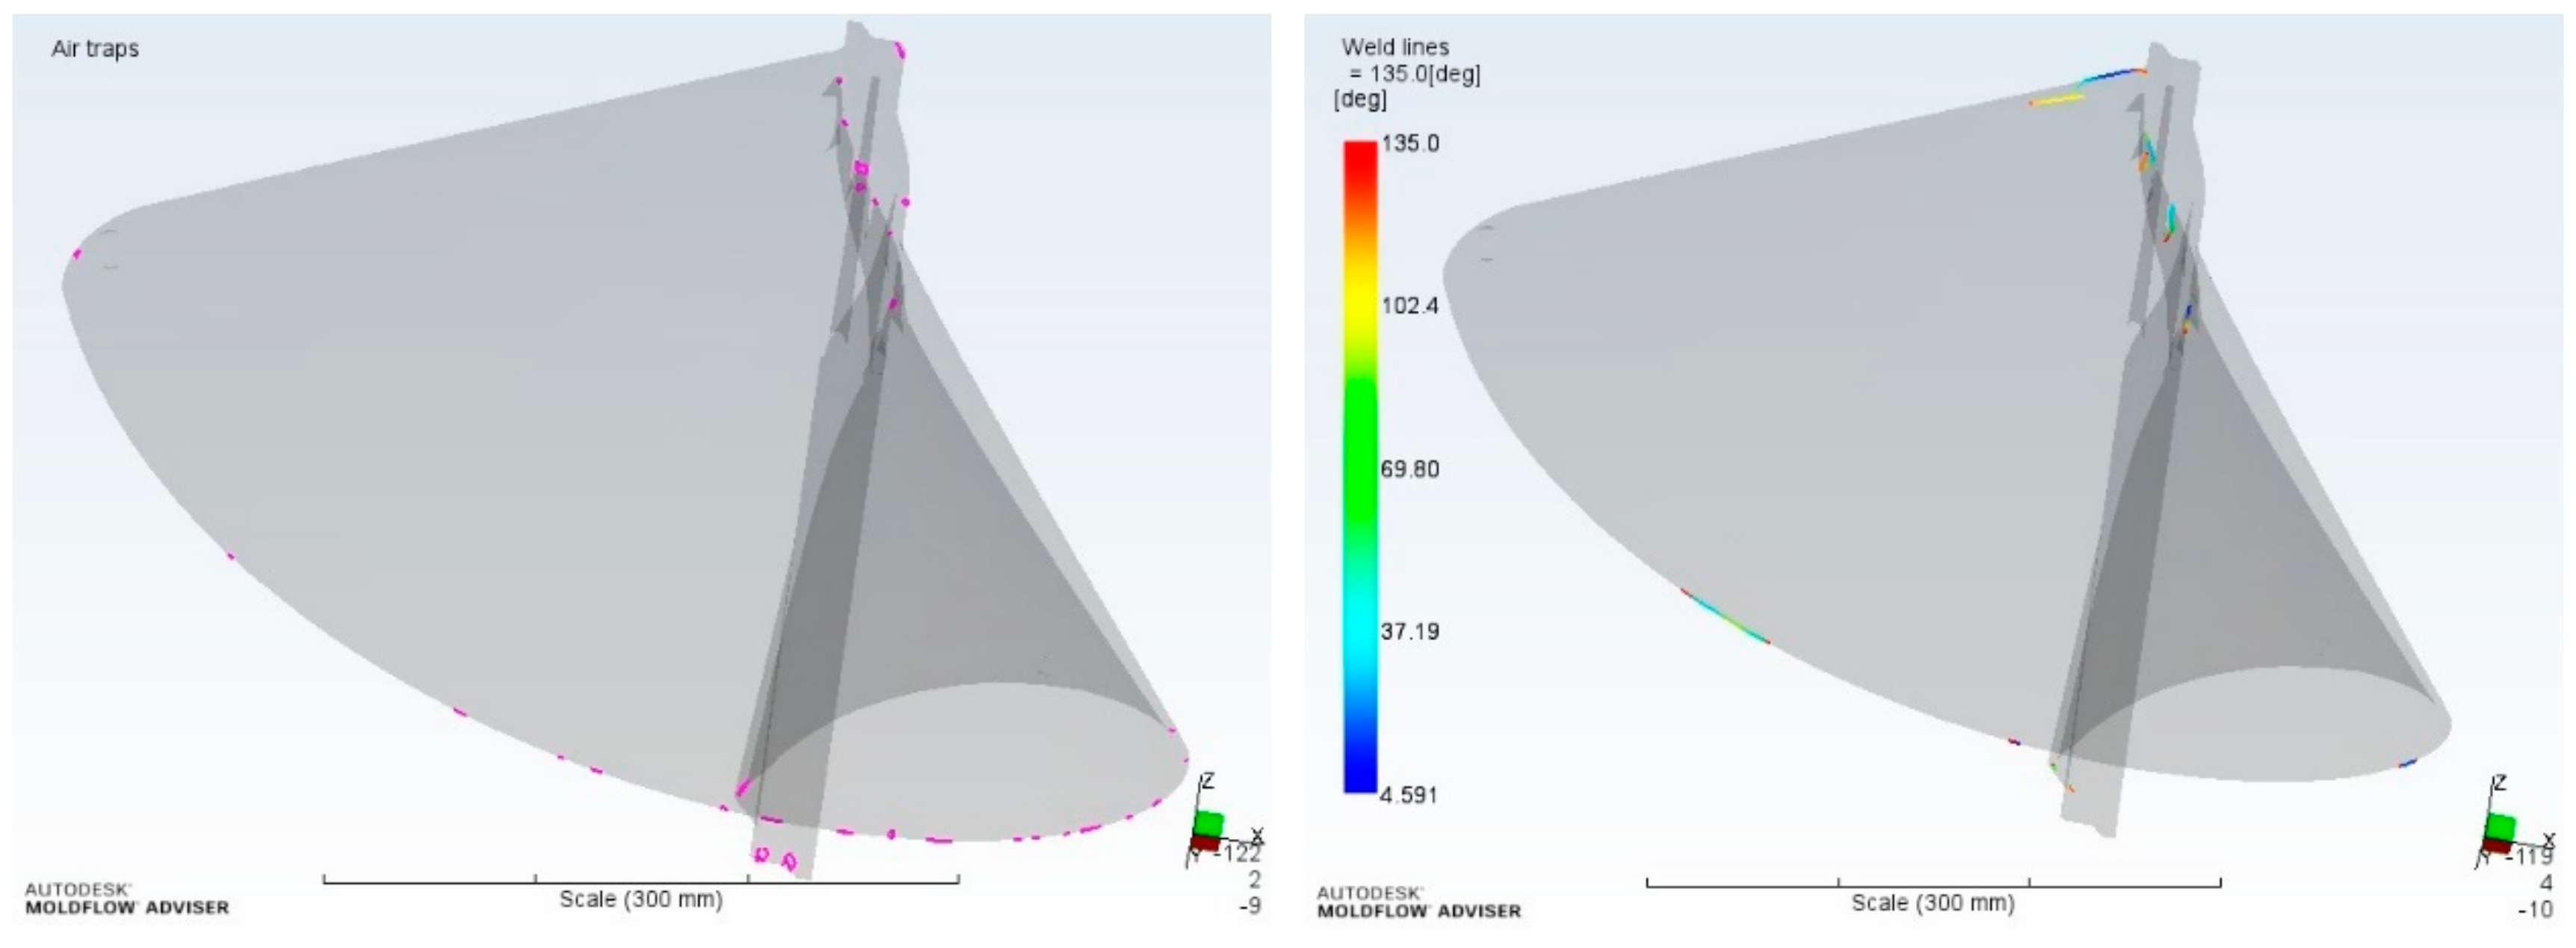
Figure 18 shows the air traps and weld lines that are likely to occur during the injection molding process. Air traps can be reduced by appropriate venting in the molds, which can be then be used to design vents required to minimize the air traps. The weld lines distribution displays the angle of convergence as the two flow fronts meet. However, the presence of weld lines may indicate a structural weakness and/or a surface blemish.
The fiber orientation at skin shown in Figure 19 provides a good indication of how molecules will be oriented on the outside of the part, thereby demonstrating the average principal alignment direction for the whole local area at the end of the filling. Since the melt freezes very quickly upon contact with the mold for the first time, the velocity vector provides the most probable molecular orientation at the skin.
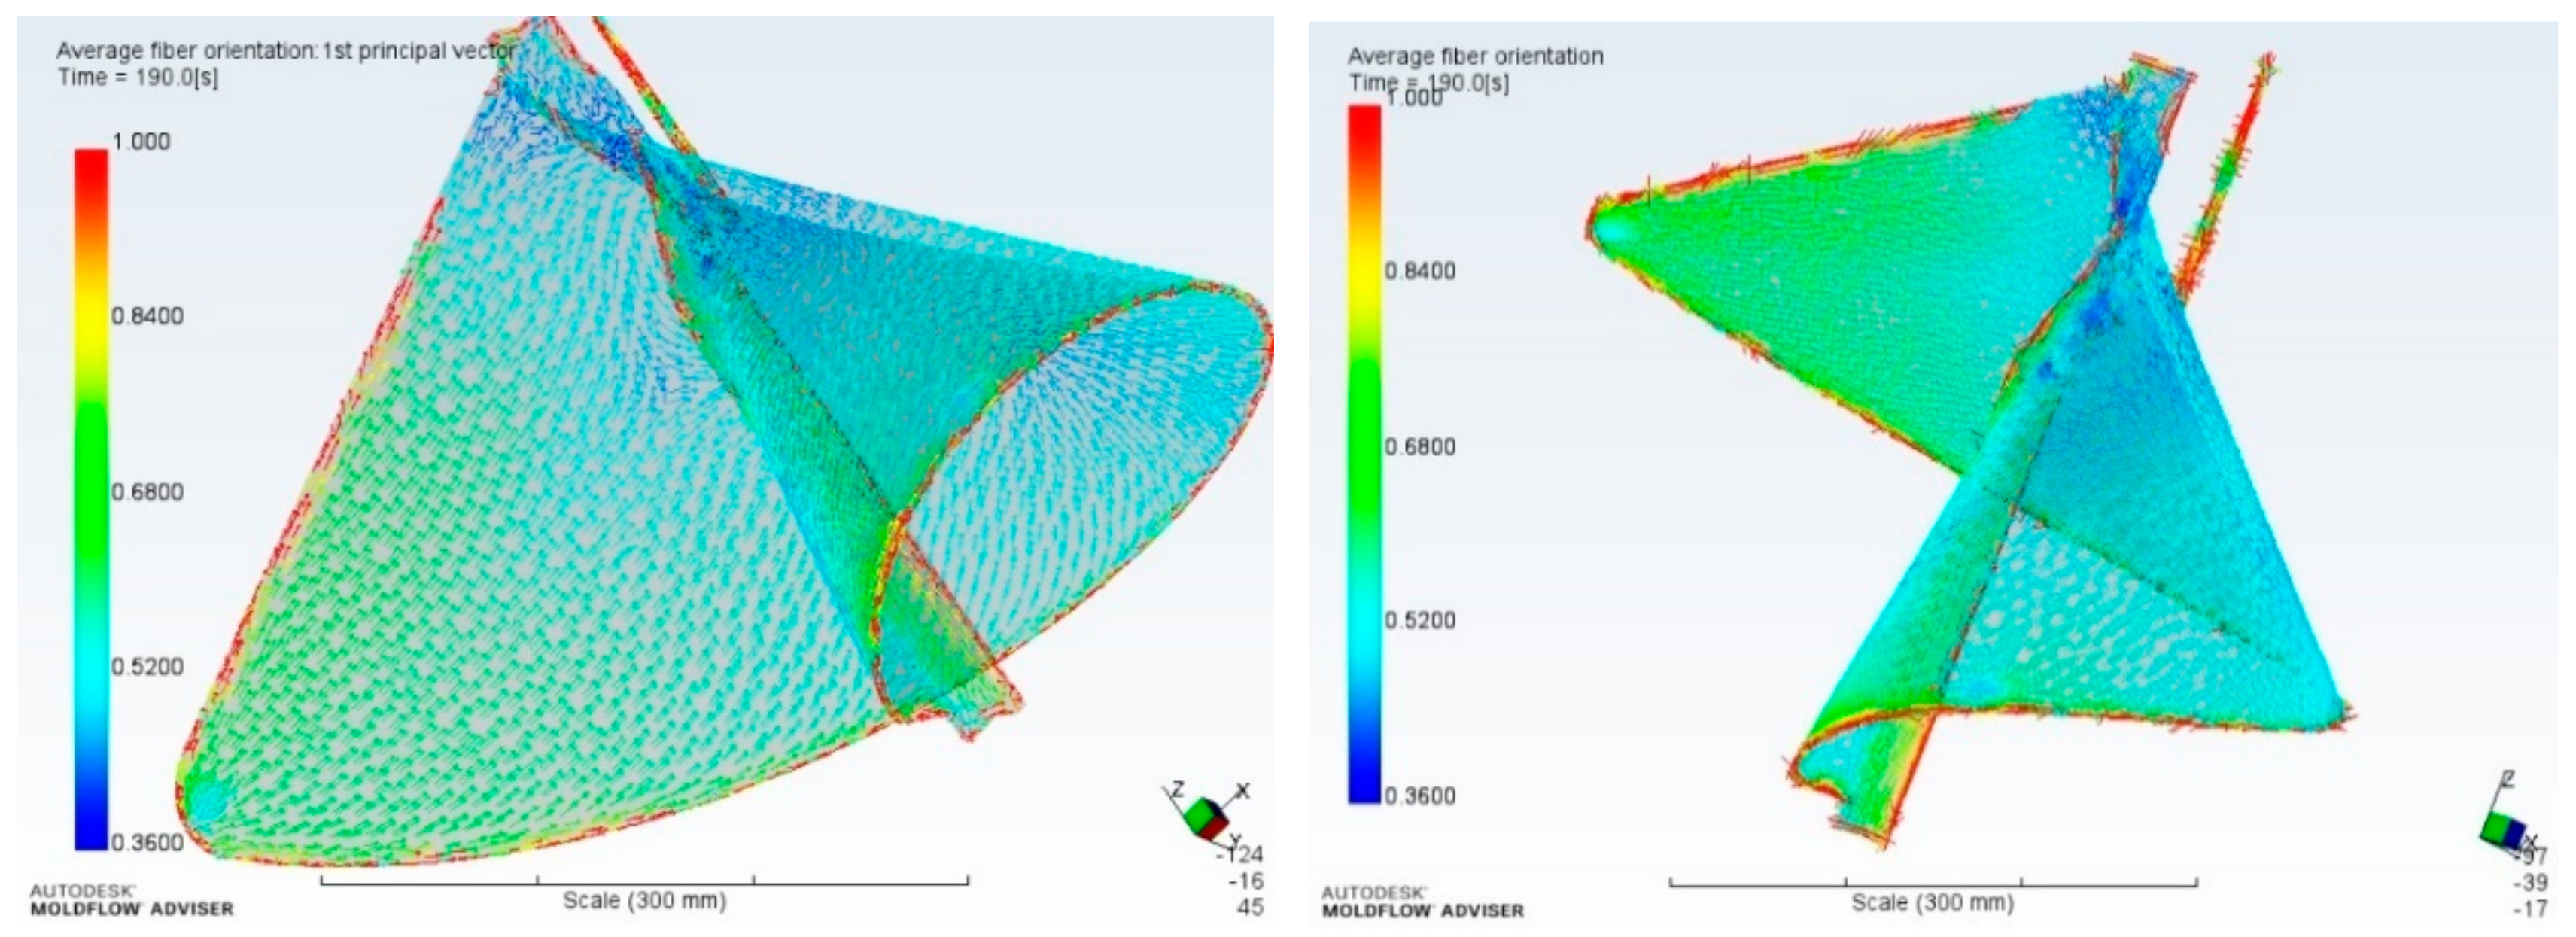
Figure 20 shows the orientation of fibers during the injection molding process, averaged over the thickness. To analyze this, the layer-based fiber orientation tensor was calculated at each time-step throughout the duration of the analysis. This tensor is a tensor whose components are the average of the components of the layer-based fiber orientation tensor over thickness.
The principal directions are numbered in the order of the respective principal values, from the largest to the smallest. The first principal direction represents the direction along which the most fibers are aligned, while the third one represents the one along which the fewest fibers are aligned. The larger the principal value, the stronger is the alignment in the corresponding principal direction.
4.3.1. Estimated Sink Mark
Figure 20 shows the presence and location of sink marks and voids likely to be caused by features on the opposite face of the surface. Sink marks typically occur in moldings with thicker sections or at locations opposite ribs, bosses, or internal fillets. These results do not indicate sink marks caused by locally thick regions. From the analysis, along the shaft where the thickness variations are prominent, possible sinks are predicted (Figure 21).
4.3.2. Deflection and Warpage
The deflection and warpage results (Figure 22) show how the part deflects from the originally designed shape. These mainly occur due to drastic differences in temperature at different part locations. This result helps design an appropriate cooling system and vary the design of the part to minimize defects during fabrication. Along the edge region, more even cooling is desired.
4.3.3. Volumetric Shrinkage at Ejection
The volumetric shrinkage at ejection (Figure 23) decreases local volume from the end of the cooling stage to when the part has cooled to the ambient reference temperature, which shows the volumetric shrinkage for each area expressed as a percent of the original modeled volume. This result matches with the aforementioned quality prediction.
5. Conclusions
In this study, we verified the final prototype AWM-750D using numerical simulations and wind tunnel tests and obtained the following main findings:
- The blade surface roughness needs to be controlled in the manufacturing process for better efficiency and stable production, and we resolved these with the injection molding method based on numerical simulation for blade production.
- The SST k-Omega model was observed to be reliable to deal with the turbulent flow for the complicated shape of our wind turbine blades. In addition, we calculated the performance of on- and off-design conditions and plotted the power curves.
- We reached the maximum power coefficient of 0.2, which was much higher than that of the same drag-type Savonius wind turbine. Nevertheless, our wind tunnel test result had some limitations due to data fluctuation during their acquisition. CFD predicted lower power output as the wind speed increases, but its overall trend was in an acceptable range compared with the wind tunnel test result.
- The injection molding was selected as the manufacturing process of wind turbine blades. Compared to other processes, injection molding enables the mass production of materials with poor machinability. When sufficient formability is secured, manufacturing the same quality product can be accomplished promptly. In addition, this process has the advantage of reducing production costs.
- Analysis of injection molding was conducted based on the CAD model reflecting the exact dimensions. To predict the formability of the product, the confidence of the fill analysis result was analyzed, and it was confirmed that the product was 100% filled with the material without void. Warpage and deflection results indicate that fine products were manufactured without deformation and identified areas vulnerable to thermal deformation. Furthermore, solutions, such as adding cooling channels at the mold design stage, were suggested. The filling time and time to reach the extraction temperature were 4.89 s and 259.4 s, respectively, and productivity can be estimated using this information. In addition, the degree and location of various defects, such as air traps and weld lines that could occur during the injection molding process, were confirmed. It was quantitatively confirmed that the integrity of the manufactured product was secured because no defects existed in the area where the stress was concentrated, such as the shaft.
Based on the findings of this study, we standardized the manufacturing method of injection molding for blades and prepared design improvement plans for the maximized performance. Future work will explore design modifications such as the flow inlet design influenced by a generator and blade passage design for reducing vortex generation. The design modification and validation of AWM-750D will be a challenge for us, regarding its commercialization.
Author Contributions
Conceptualization, B.K., H.-S.J. and S.A.; methodology, B.K. and S.-J.P.; software, B.K. and S.-J.P.; validation, B.K., S.-J.P., H.-S.J. and S.A.; formal analysis, B.K. and S.-J.P.; investigation, B.K., S.-J.P., M.-G.K. and H.-G.Y.; resources, B.K., S.-J.P., M.-G.K. and H.-G.Y.; data curation, B.K., S.-J.P., M.-G.K. and H.-G.Y.; writing—original draft preparation, B.K. and S.-J.P.; writing—review and editing, B.K., S.-J.P., H.-S.J. and S.A.; supervision, H.-S.J. and S.A.; project administration, B.K., H.-S.J. and S.A.; funding acquisition, B.K., H.-S.J. and S.A. All authors have read and agreed to the published version of the manuscript.
Funding
This work was supported by the Energy Core Technology Program of the Korea Institute of Energy Technology Evaluation and Planning (KETEP), granted financial resources from the Ministry of Trade, Industry & Energy, Republic of Korea (No. 20183030029120). This work was supported by the National Research Foundation of Korea (NRF) grant funded by the Korean government (MSIP) through the Regional Leading Research Center (No. 2019R1A5A8083201).
Institutional Review Board Statement
Not applicable.
Informed Consent Statement
Not applicable.
Conflicts of Interest
The authors declare no conflict of interest.
Nomenclature
| ρ | air density (kg/m3) |
| μ | molecular viscosity(kg/m-s) |
| τ | shear stress(kg/m-s2) |
| δ | Kronecker delta function |
| A | cross-sectional area of wind turbine |
| N | rotating speed (rpm) |
| p | static pressure (Pa) |
| R: | turbine radius (m) |
| SM | momentum source |
| U | vector of velocity Ux,y,z (m/s) |
| U∞ | wind speed (m/s) |
References
- Global Energy & CO2 Status Report. Available online: https://www.iea.org/reports/global-energy-co2-status-report-2019 (accessed on 11 February 2020).
- Global Warming of 1.5 °C. Available online: https://www.ipcc.ch/sr15/download (accessed on 11 February 2020).
- Global Energy Transformation: A Roadmap to 2050. Available online: https://www.irena.org/publications/2019/Apr/Global-energy-transformation-A-roadmap-to-2050-2019Edition (accessed on 11 February 2020).
- IEC (International Electrotechnical Commission). IEC Standard 61400-2. Wind Turbines—Part 2: Design Requirements for Small Wind Turbines. 2013. Available online: https://webstore.iec.ch/publication/5433 (accessed on 11 February 2020).
- Wood, D.H. Small Wind Turbines: Analysis, Design and Application; Springer: London, UK, 2011; pp. 145–250. [Google Scholar]
- Small Wind World Report Summary; World Wind Energy Association: Bonn, Germany, 2015.
- Small and Medium Wind UK Market Report; Renewable UK: London, UK, 2015.
- Yang, H.; Lu, L.; Zhou, W. A novel optimization sizing model for hybrid solar-wind power generation system. Sol. Energy 2007, 81, 76–84. [Google Scholar] [CrossRef]
- Khan, M.J.; Iqbal, M.T. Dynamic modeling and simulation of a small wind–fuel cell hybrid energy system. Renew. Energy 2005, 30, 421–439. [Google Scholar] [CrossRef]
- Bhandari, B.; Poudel, S.R.; Lee, K.T.; Ahn, S.H. Mathematical modeling of hybrid renewable energy system: A review on small hydro-solar-wind power generation. Int. J. Prec. Eng. Manuf. Green Technol. 2014, 1, 157–173. [Google Scholar] [CrossRef]
- Bortolini, M.; Gamberi, M.; Graziani, A.; Manzini, R.; Pilati, F. Performance and viability analysis of small wind turbines in the European Union. Renew. Energy 2014, 62, 629–639. [Google Scholar] [CrossRef]
- Bukala, J.; Damaziak, K.; Karimi, H.R.; Kroszczynski, K.; Krzeszowiec, M.; Malachowski, J. Modern small wind turbine design solutions comparison in terms of estimated cost to energy output ratio. Renew. Energy 2015, 83, 1166–1173. [Google Scholar] [CrossRef]
- Grieser, B.; Sunak, Y.; Madlener, R. Economics of small wind turbines in urban settings: An empirical investigation for Germany. Renew. Energy 2015, 78, 334–350. [Google Scholar] [CrossRef]
- Ishugah, T.F.; Li, Y.; Wang, R.Z.; Kiplagat, J.K. Advances in wind energy resource exploitation in urban environment: A review. Renew. Sustain. Energy Rev. 2014, 37, 613–626. [Google Scholar] [CrossRef]
- Hays, A.; Van Treuren, K.W. A study of power production and noise generation of a small wind turbine for an urban environment. J. Energy Resour. Technol. Trans. Asme 2019, 141, 10. [Google Scholar] [CrossRef]
- Hassanzadeh, A.; Hassanabad, A.H.; Dadvand, A. Aerodynamic shape optimization and analysis of small wind turbine blades employing the Viterna approach for post-stall region. Alex. Eng. J. 2016, 55, 2035–2043. [Google Scholar] [CrossRef] [Green Version]
- Singh, R.K.; Ahmed, M.R. Blade design and performance testing of a small wind turbine rotor for low wind speed applications. Renew. Energy 2013, 50, 812–819. [Google Scholar] [CrossRef]
- Tummala, A.; Velamati, R.K.; Sinha, D.K.; Indraja, V.; Krishna, H. A review on small scale wind turbines. Renew. Sustain. Energy Rev. 2016, 56, 1351–1371. [Google Scholar] [CrossRef]
- Pourrajabian, A.; Afshar, P.A.N.; Ahmadizadeh, M.; Wood, D. Aero-structural design and optimization of a small wind turbine blade. Renew. Energy 2016, 87, 837–848. [Google Scholar] [CrossRef]
- Teodorescu, R.; Blaabjerg, F. Flexible control of small wind turbines with grid failure detection operating in stand-alone and grid-connected mode. IEEE Trans. Power Electron. 2004, 19, 1323–1332. [Google Scholar] [CrossRef]
- Orlando, N.A.; Liserre, M.; Mastromauro, R.A.; Dell’Aquila, A. A survey of control issues in PMSG-based small wind-turbine systems. IEEE Trans. Ind. Inform. 2013, 9, 1211–1221. [Google Scholar] [CrossRef]
- Kim, K.; Ji, H.; Kim, Y.; Lu, Q.; Baek, J.; Mieremet, R. Experimental and numerical study of the aerodynamic characteristics of an Archimedes spiral wind turbine blade. Energies 2014, 7, 7893–7914. [Google Scholar] [CrossRef] [Green Version]
- Mieremet, M.; Baek, J.H. Blade Having a Divided Shaft and Blade Unit Utilizing the Blade and Method for Making the Blade Unit. U.S. Patent 10,053,986, 15 May 2014. [Google Scholar]
- Bardina, J.E.P.G.; Coakley, T.J. Turbulence Modeling Validation, Testing and Development. NASA Technical Report No 110446. 1997. Available online: https://ntrs.nasa.gov/citations/19970017828 (accessed on 4 March 2020).
- Collie, S.; Gerritsen, M.; Jackson, P. Performance of two-equation turbulence models for flat plate flows with leading edge bubbles. J. Fluids Eng. 2008, 130, 021201. [Google Scholar] [CrossRef]
- ANSYS CFX. ANSYS CFX-Solver Modelling Guide; ANSYS, Inc.: Canonsburg, PA, USA, 2013. [Google Scholar]
- Gassh, R.; Twele, J. Wind Power Plants; Solarpraxis: Berlin, Germany, 2002. [Google Scholar]
Figure 1.
Development background, assembled model, and main components of AWM-750D.

Figure 2.
Modified AWM-750D for CFD and computational domain.

Figure 3.
Grid generation.

Figure 4.
Installed AWM-750D and test facility.

Figure 5.
Design for injection molding.

Figure 6.
Viscosity vs. shear rate plot of Supran PP1340 with varying temperatures.

Figure 7.
Related parameters’ distribution of the coolant circuit.

Figure 8.
Velocity and pressure contours along the vertical section.

Figure 9.
Pressure contour along the wind turbine surfaces.

Figure 10.
Velocity vector at the surface of constant radius.

Figure 11.
Velocity vector around rotating blades and Q-criterion for vorticity.

Figure 12.
Model for mass balance verification.

Figure 13.
Power vs. rotational speed of wind tunnel test results.

Figure 14.
Power coefficient vs. TSR plot of wind tunnel test results.

Figure 15.
Power vs. speed comparison using CFD and wind tunnel test.

Figure 16.
Fill time, confidence, and quality prediction results.

Figure 17.
Time to reach ejection temperature and average temperature distribution at that time.

Figure 18.
Air trap and weld line distribution.

Figure 19.
Predicted fiber orientation.

Figure 20.
Average fiber orientation.

Figure 21.
Estimation of Sink marks.

Figure 22.
Results of Deflection and warpage.

Figure 23.
Volumetric shrinkage at ejection.


Table 1.
Geometric dimensions of the blade.
| Axes | Dimension (mm) |
|---|---|
| X | 558.500 |
| Y | 385.628 |
| Z | 476.494 |
Table 2.
Material properties (Supran PP1340).
| Material ID (Manufacturer) | Supran 1340 (SAMBARK LFT) |
|---|---|
| Family abbreviation | PP |
| Material structure | Crystalline |
| Fibers/fillers | 40% Long Glass Fiber |
| Elastic modulus | 9726.03 MPa |
| Shear modulus | 2018.68 MPa |
| Shrinkage | 0.4–0.9% |
| Melt temperature | 245.0 °C |
Table 3.
Molding process parameters.
| Mold temperature | 55.0 °C |
| Injection location | 1 |
| Max. machine injection pressure | 180.000 MPa |
| Gate type | Cold/Circular tapered |
| Injection time selected | Automatic |
| Velocity/pressure switch-over | Automatic |
| Ejection temperature | 115 °C |
Table 4.
Torque and power based on turbulence models applied under the design condition.
| Models | Torque [Nm] | Power [W] |
|---|---|---|
| Standard k-epsilon | 1.688 | 97.23 |
| RNG k-epsilon | 1.684 | 96.97 |
| k-omega | 1.674 | 96.39 |
| k-omega SST | 1.719 | 99.10 |
Publisher’s Note: MDPI stays neutral with regard to jurisdictional claims in published maps and institutional affiliations. |
© 2021 by the authors. Licensee MDPI, Basel, Switzerland. This article is an open access article distributed under the terms and conditions of the Creative Commons Attribution (CC BY) license (https://creativecommons.org/licenses/by/4.0/).
Share and Cite
MDPI and ACS Style
Kim, B.; Park, S.-J.; Ahn, S.; Kim, M.-G.; Yang, H.-G.; Ji, H.-S. Numerically and Experimentally Verified Design of a Small Wind Turbine with Injection Molded Blade. Processes 2021, 9, 776. https://doi.org/10.3390/pr9050776
AMA Style
Kim B, Park S-J, Ahn S, Kim M-G, Yang H-G, Ji H-S. Numerically and Experimentally Verified Design of a Small Wind Turbine with Injection Molded Blade. Processes. 2021; 9(5):776. https://doi.org/10.3390/pr9050776
Chicago/Turabian StyleKim, Byunghui, Sang-June Park, Seokyoung Ahn, Myung-Gon Kim, Hyung-Gun Yang, and Ho-Seong Ji. 2021. "Numerically and Experimentally Verified Design of a Small Wind Turbine with Injection Molded Blade" Processes 9, no. 5: 776. https://doi.org/10.3390/pr9050776
Note that from the first issue of 2016, this journal uses article numbers instead of page numbers. See further details here.